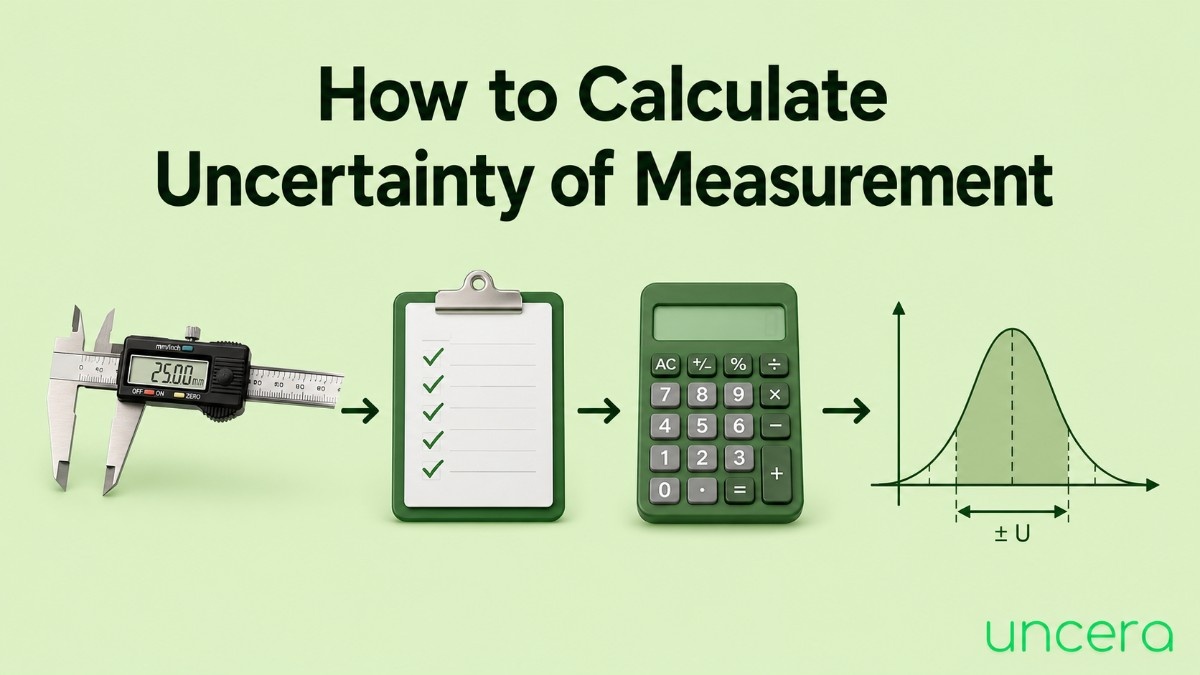
Most people meet measurement uncertainty as a formula on a slide and never quite recover. It looks like statistics homework. It isn’t. It’s bookkeeping you list everything that could make your measurement wrong, put a number on each one, and add them up in a slightly unusual way.
That’s it. Eight steps, and you can do the whole thing in a spreadsheet.
This guide walks through the complete calculation, from your first repeated reading to the ± figure you write on the report. There’s a full worked example partway down, so if you learn better by seeing the numbers move, skip ahead to it and come back.
The Short Version
Here’s the whole process in six lines, so you know where this is going:
- List every source of uncertainty in your measurement.
- Work out a value for each one.
- Convert them all into standard uncertainties (the same statistical units).
- Combine them by squaring, adding, and taking the square root.
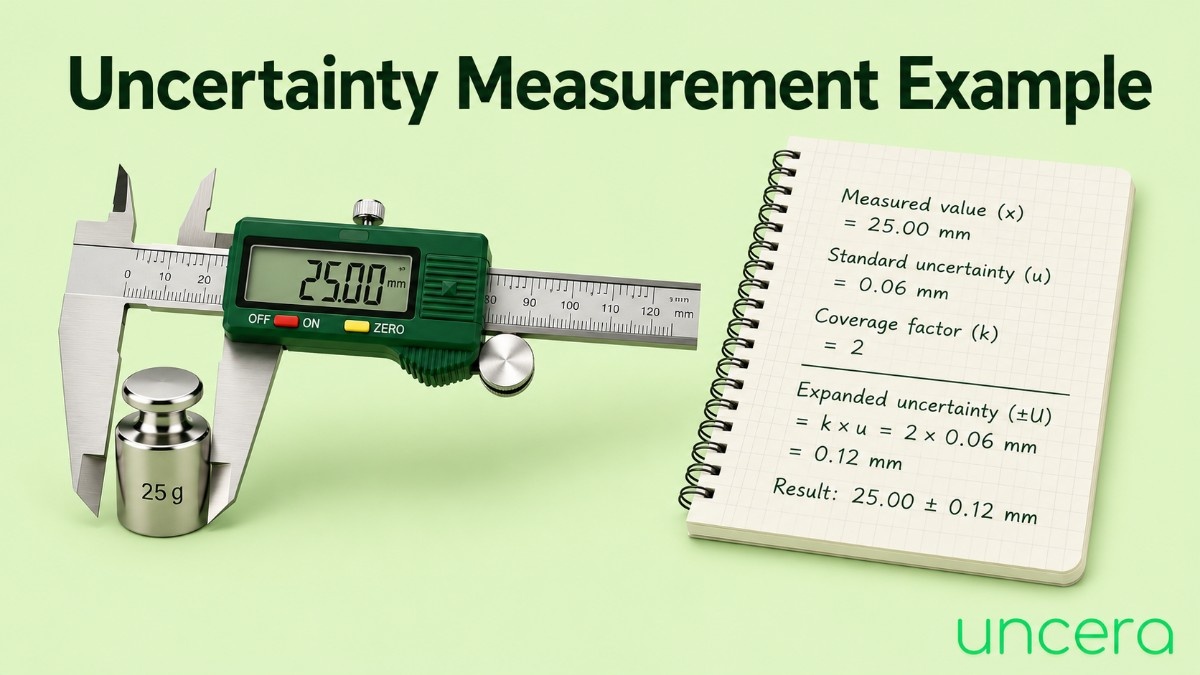
- Multiply by a coverage factor, usually 2.
- Report your result as value ± uncertainty.
The two formulas that matter:
Combined standard uncertainty: u꜀ = √(u₁² + u₂² + u₃² + …)
Expanded uncertainty: U = k × u꜀
Everything below is just detail on how to fill in those u values.
Before You Calculate Anything: Define the Measurand
This step gets skipped constantly and it causes more trouble than any formula.
The measurand is the specific quantity you’re measuring. Not “the shaft” the diameter of the shaft, at the midpoint of the journal, at 20 °C, measured with an outside micrometer.
Why the fuss? Because your list of uncertainty sources depends entirely on this definition. If your measurand includes “at 20 °C” but you measured at 26 °C, thermal expansion becomes a source you have to account for. If your measurand is “the diameter at the midpoint” but the shaft is slightly tapered, where exactly you placed the micrometer becomes a source too.
Write one clear sentence describing what you’re measuring, under what conditions, with what. Then start listing.
Source of Uncertainty
Sit down and brainstorm everything that could shift your reading. Six families cover almost all of them:
- The instrument – resolution, its own calibration uncertainty, drift, wear, hysteresis
- The reference standard – your slip gauge or setting ring has an uncertainty from its own calibration, and it passes straight through to you
- The environment – temperature above all, then vibration, humidity, air pressure
- The operator – measuring force, parallax, alignment, judgement
- The workpiece – roundness, flatness, surface roughness, taper
- The method – clamping, fixturing, probe strategy, how many points and where.
You won’t quantify all of them. Some will turn out to be negligible and you’ll drop them. But list them first and prune later the source you never wrote down is the one that quietly ruins your result.
A fishbone diagram helps here if you’re doing this as a team. On your own, a plain list is fine.
Calculate Type A Uncertainty From Repeated Readings
Type A uncertainty is the part you get from statistics. Take several readings of the same thing, and let the spread tell you how repeatable your measurement is.
Take your readings. Five is a sensible minimum, ten is better. Measure the same feature the same way each time.
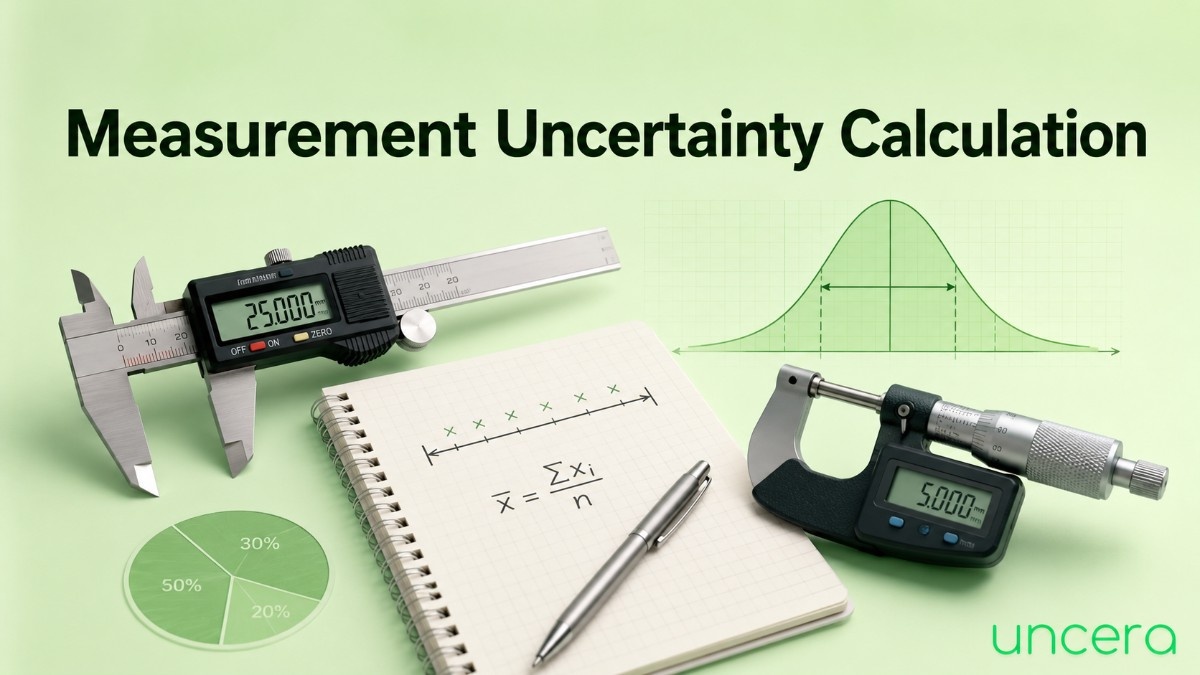
Calculate the mean. Add them up, divide by how many.
Calculate the standard deviation (s). Use the sample standard deviation, not the population one in Excel that’s STDEV.S, not STDEV.P. This trips people up regularly, and with small samples the difference is not small.
Divide by the square root of n:
u_A = s ÷ √n
That last step is the one students find odd. Why divide by √n? Because you’re not reporting a single reading you’re reporting the mean of your readings, and a mean is more reliable than any individual measurement. Take four times as many readings and this contribution halves.
It also tells you when to stop. Going from 5 readings to 10 buys you a 30% improvement. Going from 10 to 20 buys you another 30%. At some point the effort stops being worth it, and usually that point arrives sooner than people expect.
How to Calculate Uncertainty From a Single Reading

Sometimes you only get one shot, and there’s no standard deviation to work with. You can still assign an uncertainty.
Analogue instruments: half the smallest scale division. A steel rule marked in millimetres → ±0.5 mm. A dial gauge reading to 0.01 mm → ±0.005 mm.
Digital instruments: ±1 in the last displayed digit. A display reading 12.46 mm → ±0.01 mm.
Both of these give you the resolution uncertainty only, and it’s the floor, not the whole answer. If the instrument has a calibration certificate quoting something larger, use that instead. It usually will.
How to Calculate Percentage Uncertainty

Percentage uncertainty lets you compare measurements that have completely different units.
Percentage uncertainty = (absolute uncertainty ÷ measured value) × 100
25.002 ± 0.004 mm (0.004 ÷ 25.002) × 100 = 0.016%
Two things it’s useful for. First, comparing your instrument’s performance across different sizes the same micrometer gives a much worse percentage uncertainty on a 2 mm part than a 200 mm one. Second, propagating uncertainty through multiplication and division, which is the next section.
Divide by the value, not the uncertainty. It sounds obvious. It’s a surprisingly common slip under exam pressure.
How to Calculate Uncertainty When You Combine Measurements
You often measure two things and calculate a third. Each measurement drags its uncertainty into the result. Three rules cover almost everything:
Adding or subtracting → add the absolute uncertainties
12.5 ± 0.1 mm plus 8.3 ± 0.1 mm = 20.8 ± 0.2 mm
Note that subtracting doesn’t shrink the uncertainty. Uncertainties never cancel they only accumulate.
Multiplying or dividing → add the percentage uncertainties
Length 50.0 ± 0.1 mm (0.2%) × width 25.0 ± 0.1 mm (0.4%) Area = 1250 mm², combined 0.6% = 1250 ± 8 mm²
Powers and roots → multiply the percentage uncertainty by the power
Cube of side 20.0 ± 0.1 mm (0.5%) Volume = 8000 mm³, uncertainty 3 × 0.5% = 1.5% = 8000 ± 120 mm³
A square root counts as a power of ½, so it halves the percentage uncertainty.
These simple-addition rules are deliberately cautious. For independent sources, the statistically correct approach is quadrature √(0.2² + 0.4²) = 0.45% for the area example, rather than 0.6%. Coursework generally wants simple addition; professional work wants quadrature. Check which applies before you use it.
Common Mistakes When Calculating Uncertainty
Using population standard deviation instead of sample. STDEV.P instead of STDEV.S in Excel. With five readings the error is around 12%, and it always goes the wrong way it makes your uncertainty look smaller than it is.
Adding standard uncertainties directly instead of in quadrature. Squares first, then add, then square root. Straight addition inflates your uncertainty substantially and makes your measurement look worse than it is.
Forgetting to divide by √n in the Type A calculation. The standard deviation describes the spread of individual readings. You’re reporting a mean, and the mean is more reliable than any single reading.
Forgetting the divisors on Type B sources. Dropping a k=2 certificate value straight into the budget doubles that contribution. Convert everything to standard uncertainty first that’s the entire point of Step 4.
Mixing up resolution and half-resolution. For rectangular distributions you take half the resolution as the half-width, then divide by √3. Using the full resolution doubles the contribution.
Quoting uncertainty to four decimal places. ±0.003527 mm claims you know your doubt to four figures. You don’t. One significant figure, two at most.
Mismatched decimal places between value and uncertainty. 25.0024 ± 0.004 is inconsistent. Match them.
Omitting the coverage factor. ±0.004 mm could mean 68% or 95% confidence. Without k, the reader can’t tell, and the number is nearly useless.
Treating a known bias as uncertainty. If your certificate says the micrometer reads 0.002 mm high, correct for it. A known error should be removed, not absorbed into your uncertainty band.
Leaving out temperature. On anything long or precise, thermal effects are frequently the dominant term and they’re the one most often forgotten entirely.
Frequently Asked Questions
What is the formula to calculate uncertainty of measurement?
There are two. The combined standard uncertainty is u꜀ = √(u₁² + u₂² + …), where each u is a source expressed as a standard uncertainty. The expanded uncertainty is U = k × u꜀, where k is the coverage factor usually 2 for about 95% confidence.
How do you calculate Type A uncertainty?
Take repeated readings, calculate the sample standard deviation, then divide by the square root of the number of readings: u = s ÷ √n.
How do you calculate Type B uncertainty?
Take the value from a calibration certificate, manufacturer’s specification, resolution or published data, then divide by a factor based on its distribution 2 for a k=2 certificate, √3 for rectangular sources like resolution and tolerance limits.
Why do we divide by √3?
Because a rectangular distribution where the true value is equally likely anywhere between two limits has a standard deviation equal to its half-width divided by √3. It’s a property of the distribution, not an arbitrary choice.
Why combine uncertainties in quadrature instead of adding them?
Simple addition assumes every source goes wrong in the same direction simultaneously. Independent sources scatter randomly and partly cancel, and quadrature is the mathematically correct way to account for that.
What does k = 2 mean?
k is the coverage factor. Multiplying the combined standard uncertainty by 2 widens the interval from about 68% confidence to about 95%.
How many readings do I need?
Five as a minimum, ten if it’s quick. Because uncertainty falls as √n, the returns diminish fast going from 10 readings to 40 only halves the Type A contribution.
Can I calculate uncertainty from a single measurement?
Yes, but only Type B. Use half the smallest scale division for analogue instruments, or ±1 in the last digit for digital ones, plus any calibration certificate figure. You just won’t have a repeatability term.
Should uncertainty be reported to one or two significant figures?
One is standard for coursework. Many accredited laboratories use two throughout. Either works pick one and apply it consistently.
How small should my uncertainty be?
Small enough for the decision you’re making. A common guideline is no more than a quarter of the part’s tolerance. Beyond that you’re spending money for no benefit.
Conclusion
Calculating measurement uncertainty is bookkeeping with one unusual arithmetic rule. List your sources, put a number on each, convert them to the same units, combine in quadrature, multiply by two, round sensibly.
The parts worth remembering:
- Define the measurand first. It determines everything that follows.
- Type A comes from your readings (s ÷ √n). Type B comes from documents (divide by 2 for a k=2 certificate, by √3 for rectangular sources).
- Convert everything to standard uncertainty before combining. Skipping this step is the most common error in the whole process.
- Combine in quadrature, not by adding. Squares, sum, square root.
- Multiply by k = 2 for roughly 95% confidence, and always say so.
- Round the uncertainty to one significant figure, then match the value’s decimal places to it.